
SIGNAL by DATACRAFT
- Jason Lucey
- Apr 30
- 17 min read

This document is combo manifesto and white paper, blending my personal mission to solve problems I've discovered over decades of experience with answers I've developed and refined. It reflects my commitment to addressing persistent challenges that led me to develop a methodology/tool I call SIGNAL.
It's a long document, so here is a table of contents to help you navigate:
Part 1: Problems That Never Go Away
For years, I have watched marketing teams get caught between two tough positions. On one side are direct-response systems that reward whatever can be immediately tracked. On the other side are broad “brand” narratives that assume upper-funnel activity matters but often struggle to show how, when, or where that influence honestly shows up to impact business outcomes.
I’ve seen media teams contort themselves to find measurable impact from “upper funnel” media buys, account executives freak out in the face of vague results that could threaten next year’s budget, and numbers be presented with so many hidden caveats that the only hope is the client simply would not know what questions to ask.
As the analytics lead on many of these projects, I’ve been guilty of many of the same things. It’s heartbreaking. The truth is that sometimes there are no good answers because the same issues always come up:
No one can really say what the value of impressions is.
"Above the funnel" tactics are very difficult to connect to "bottom of funnel" results.
Data gaps are attribution killers.
Analytics setups are brittle, often out of date, and require frequent repairs.
The “customer journey” is all theory with very little data to prove it out.
It’s hard to say if the strategy was right or wrong by the time media is in market.
Privacy compromises data quality.
Attribution makes unpaid sources look like they did everything.
Maybe it’s because I've been faced with these issues so many times over the past 25+ years dedicated to marketing analytics, that I felt the need to take a hard look at the situation and put forward what I think is a unique and important innovation in marketing measurement. The methodologies for SIGNAL are things that I have been developing for some time. The technologies to implement it are a mix of old school data modeling combined with advanced dashboards and AI enabled rapid prototyping, which accelerated the development process greatly.
Before getting into how SIGNAL works, there are three key aspects that I want to explore. These understandings underpin the rationale behind why a tool like SIGNAL is even needed. They are: the nature of human decision making, the importance of consistent measurement, and the need for a new paradigm in how we understand response.
Funnels, Journeys, and the Reality of Behavior
Funnels are the most common way that marketing teams think about behavior. Almost every “performance based” analysis relies on funnel progression as the key to understanding insights and optimization.
Funnels can be very useful abstractions, but they are still abstractions. They prioritize stage completion, orderly progression, and expediency. Funnel analysis also treats the normal human decision-making process as full of errors that need to be corrected. These errors are called “attrition”. The corrections are called “optimization”. Ultimately, funnels want to be tubes, with zero attrition and zero hesitation. However, this is simply not reality.

The truth is, a person may see an ad on one device, search later on another, revisit through email, talk with a spouse, come back via text message, and complete part of the process offline. The amount of disconnected start, stops, backtracking, and redundancy creates substantial complications for a funnel model. When behavior does not conform to the model, it can create gaps which become blind spots for marketing teams.
Most marketing analysis is biased toward temporal proximity—that is whatever happens closest to the conversion in time is best. If a channel does not produce conversion credit quickly, it is suspected of being weak. But immediate results are not the highest form of evidence; it is merely the easiest form to instrument and identify. In slow-moving, trust-dependent, multi-stakeholder, or highly regulated environments, the influence of media can be distributed widely. Equating slow-moving with ineffectiveness is one of the most persistent blind spots in marketing analytics.
This is not an unknown issue. There are several methods and tools that try to account for the messy, fractured reality of decision journeys and the influences that work therein. Multi-Touch Attribution (MTA) is a notable one that uses stitching to assemble disparate fragments into a linear chain of events. Look-Back Windows are another, which tries to account for delay effects by creating a catch-all association and scooping up everything it can. It is not the purpose of this paper to explore the pros and cons of each of these. Suffice to say, I believe the cons outweigh the pros in most cases, and believe a new approach is needed.
The Importance of Impact and the “Fallacy of Brand”
In “How Brands Grow”, Byron Sharp makes it very clear:
“The purpose of brand advertising is to affect the buying behavior of consumers.”
That is the anchor. It means the real question is not whether upper-funnel or non-click media is “brand” or “performance,” but whether it appears to influence the probability of downstream action. Brand is not the artistic cousin of “real” performance marketing. It exists to encourage buying behavior. Sharp also notes that:
“There is solid empirical evidence that brand advertising does produce sales. Yet the effects of advertising are very difficult to see in sales trends. The reasons for this are not well understood... Advertising’s sales effects are spread out in time...changes in advertising spend and changes in overall sales report a weak association.”
These observations confirm the central problem: advertising matters even when its effect is not obvious immediately.
There are some important practical points that Sharp misses. In much real-world media execution, spend is not a uniform push into the market. It is worth noting that Sharp does not account for—or even mention—the effect of waste and optimization in marketing activities. He assumes all marketing dollars have equal value. However, contrary to Sharp’s consistent model, what we do know is:
Some placements are poorly optimized.
Some audiences are poorly understood.
Some campaigns are poorly planned.
Some channels can be over-bought or under-delivered.
Considering this reality, the "weak associations" that Sharp calls out may not only be due to the diffuse and delayed nature of advertising effects, but also the fact that much of the delivery is mediocre, inefficient, or irrelevant. Put bluntly, a lot of marketing just sucks.
Brand marketing often cultivates the fallacy that it should be granted a kind of conceptual exemption from accountability to real business impact. There is “performance marketing”, and there is “brand marketing”. Once brand is spoken of as a separate objective, ideas for how to measure its effectiveness become separate, vague and highly subjective. Activities are described as “building awareness,” “improving consideration,” “warming up the lead,” or “share of mind”. The connection to eventual business impact becomes blurred or deferred indefinitely.
Even worse is when brand is held to the same analytic framework as direct response media. The gravity of conversion pulls broad awareness campaigns down into the funnel. Eventually, after enough grueling performance reviews, awareness morphs into just another form of direct response. The slow process of conforming brand awareness to a conversion rate optimization mindset is torturous for everyone. I believe it is all due to the limited ways we have to understand what “impact” is and how it happens.

Because of these murky waters, many marketing teams find themselves in the position of throwing out the baby with the bathwater because they are missing:
An inclusive measurement framework that includes the non-linear reality of decision making.
The empirical evidence that fuels the framework
That is why having an unbiased way to survey marketing activity and tie it back to verifiable business impact is critical. The “Fallacy of Brand” is not an anti-brand argument. It is an anti-separation argument.
Relationships are a New Paradigm
When we look at marketing response, and we try to turn that into a measurement framework, there are new ideas that need to be included. The old ways of linear funnel optimization are incomplete. The increasingly invasive methods of MTA and AI modeling have problems of their own—logically, technically, legally and ethically. We need a new paradigm that allows for non-linear, non-proximate, non-temporal human behavior while still respecting privacy and staying tethered to true business impact. Relationships fit these needs well.
Measurable relationships are not only possible; they are critical.
A relationship is not merely the co-occurrence of two variables. It is the patterned alignment of intention and outcome across time in a way that suggests one may meaningfully influence the other. This matters because marketing influence is rarely instantaneous. Media is delivered now; the response may occur later. Sometimes later means days, weeks or even months. Sometimes the influence requires many touches and an “accumulation of goodwill” in anticipation of “the moment of need.”
Time + Parity --> Relationships
Time creates space for the relationship to happen. Time can be immediate—the effect occurs in the same period as the cause—or it can show up later (sometimes much later).
Parity means alignment in objective: the marketing activity is designed and intended to affect a specific KPI. Without the intentional alignment of action and outcome, there is no relationship worth measuring.
Immediate parity is best understood using direct attribution: a click leads to a conversion. This is well understood, well instrumented, and well optimized.
Parity that is delayed (where the marketing activity and the business outcome are aligned in purpose but separated in time) is not well understood and is systematically undervalued.
The idea of “journeys” takes this one step further. Human decision making takes time, is frequently non-linear, and may include many touches. This is behavioral reality. Decision journeys include hesitation, repetition, trust formation, message carryover, offline completion, interrupted browsing, and uneven pacing. The more complex the decision environment, the less likely the actual behavior is to resemble a funnel and the more likely it is to be a journey. Journeys are multifaceted relationships.
Because of this, we can neither be content with “attention metrics” nor dismissive of them. We need to ask a harder question: under what conditions does a media metric behave as though it belongs to the same conversion journey as the KPI being measured? The media metric is not good enough on its own. This is vanity.
However, it can be an important predictor of downstream impact if impressions, reach, sessions, or clicks meaningfully precede applications, sales, revenue, or another real business outcome. Those upstream “vanity metrics” are no longer just surface observations. They become candidate indicators of journey influence.
In this way, by understanding both the linear response and the non-linear relationships between media and business impact, we form a new framework that gives us the language and the tools needed to understand the reality of marketing effect with much more nuance. It can best be understood this way:
Relationship + Response --> True Impact
Part 2: What is SIGNAL?
SIGNAL begins from a practical problem in marketing measurement: much of what influences conversion happens before typical attribution systems are able to see it clearly, and much of what is easy to measure is not necessarily what is most important.
SIGNAL was developed to help marketing teams understand where and when upstream influence creates value. This is meant to complement and, in some cases, go beyond traditional attribution modeling, even multi-touch attribution and extended look-back windows.
Its core proposition is straightforward: if marketing activity matters, it should show up in more ways than direct attribution to conversion. It should also exist as patterned relationships to later business outcomes. Most teams are forced to choose between short‑window proof and long‑window story. SIGNAL was built for the unresolved middle — the space where influence is real, consequential, and measurable, but not immediately attributable.
SIGNAL is built around exposing influence that typical attribution systems almost always miss.
This is the operational premise of SIGNAL. It is not an attempt to mystify marketing or revive the old language of “brand effects” without evidence. It is an attempt to identify, test, and empirically link upstream marketing to downstream business impact.
The SIGNAL Methodology in Practice
At the practical level, SIGNAL is a decision-support framework that explores specific datasets and tests whether selected predictor metrics appear to have a reliable relationship to selected business outcomes across a range of possible time periods.
First: Identify Parity
All campaign strategies are based on the idea of cause and effect. Media and messaging are pushed into the marketplace with the intention of influencing the prospective customer to take steps toward a decision. Identifying this intentionality is the critical first step for SIGNAL. It is not looking for random correlations or impacts by happenstance. It is seeking to prove the theories that strategy puts forward.
To begin, the analyst selects the relevant upstream metrics, such as impressions, reach, fan growth, or offsite engagement, and pairs it with the downstream KPI that represents the objective those upstream efforts are intended to impact. This select dataset needs to be broad enough to allow for a messy human decision process yet constrained in its purpose to impact a specific outcome.
Second: Explore a Flexible Understanding of Time
From there, SIGNAL evaluates the dataset to reveal whether a touchpoint behaves as an immediate response driver, an early-stage leading indicator, a mid-journey influence, or not much of anything at all.

With SIGNAL, time windows can vary by client and business need. Some situations are exposed in days, others in weeks or months. In this way, SIGNAL makes exposing the lifecycle of a placement a deliverable unto itself—when a media placement might be effective and how long it may take for influence to take hold. Learning the lifecycle of each placement is a core and unique deliverable of SIGNAL. It discovers when influence appears to matter across different phases of the customer's journey. SIGNAL does not assume that a metric belongs to a useful stage. It asks the data whether that stage-like relationship exists and lets the answer emerge unbiased from the empirical record itself.
Third: SIGNAL Score to Expose Relationships
The platform then expresses the relationship through the SIGNAL Score, a custom composite metric combined with a variety of data integrity factors that are suited to noisy and non-linear data. The result is a disciplined methodology to identify which media placements deserve serious attention, which are moderately related, and which have no empirical relationship at all.
Granularity Matters Because It’s More Actionable
SIGNAL is distinctly different from other econometric approaches. Whereas MMM techniques rely on channel relevance, SIGNAL is designed to work where analysts and media managers do—at the individual placement level.

SIGNAL looks for non-exclusive relationships of every piece of media to the intended business outcome and provides scoring both individually and in aggregate. This is a critical feature that makes SIGNAL operationally relevant to every review cycle, not just semi-annual strategic reviews or annual media budgeting cycles. Broad aggregate modeling can flatten meaningful variance. When strong placements and weak placements are averaged together, the resulting signal may look disappointingly weak even if a subset of the media is doing real work. SIGNAL prevents this by preserving granularity for as long as possible and asking which specific placements, audiences, or combinations appear to carry the real relationship. This granularity is one of the reasons SIGNAL can expose insights that other methodologies often miss.
Importantly, it also means the findings can be directly lined up with conventional attribution reporting. The exposed relationships leading up to the final direct response deliver the full picture of how impact happens. This complementary effect puts SIGNAL on a different plane than other supplemental methods, such as brand lift studies. It means SIGNAL can dovetail with direct response analysis and enrich the common understanding of performance rather than being a separate voice. This collaborative aspect is distinctly unique in the media measurement world.
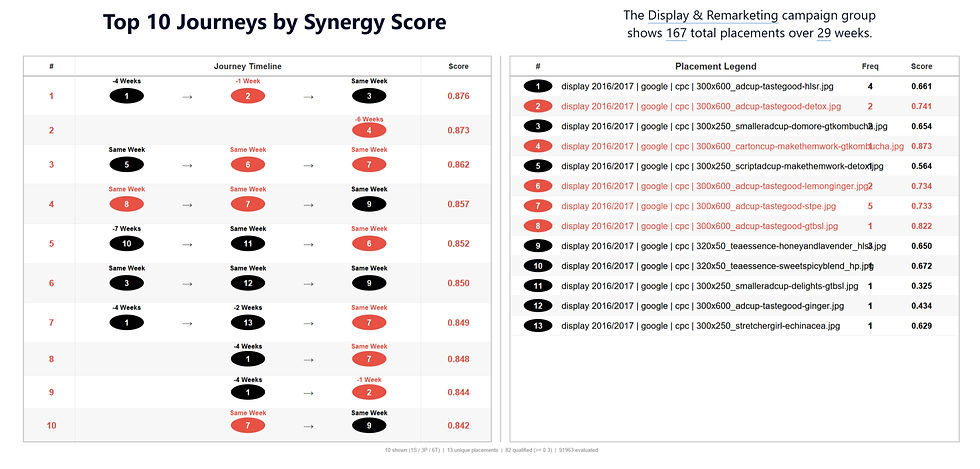
Media Synergy as Journey
SIGNAL uses the word “journey” in a stricter sense than typical marketing rhetoric. A journey is not just a story about how a customer gets “from A to B to D”. With SIGNAL, a journey is a non-exclusive combination of relationships that happen in sequence or in parallel to produce an overall stronger positive relationship than any individual placement. Most importantly, it emerges naturally from the evidence, does not rely on pre-determined media plans, and frequently exposes new learnings in the face of strategic assumptions.
In that sense, SIGNAL begins to map not only what appears to matter, but how different touches may belong together across time. That is where the idea of journey becomes more than rhetoric and starts to take on empirical structure. This also clarifies that these influence relationships are often non-exclusive: the synergy of multiple placements can surface within the same time period, and the journey need not behave like a hard sequential model. In that respect, SIGNAL is a counterpoint to Occam’s-razor style optimization that forces the system toward a single “best” driver; it treats performance as an interacting set of influences, closer in spirit to systems theory than the traditional reductionism of optimization programs.
Ultimately, SIGNAL looks less at path reconstruction and more at reliable relationships between delivery and outcome regardless of platform. This reveals the true influences shaping the customer journey.
From Discovery to Optimization
SIGNAL is not only a relationship discovery engine. It is also an optimization framework. Once the system identifies which relationships appear meaningful, it can ask a second set of questions: Does the historical record indicate the placement may be over or under delivering? Are there signs of diminishing returns?

This is where the additional analysis modules of SIGNAL become important. Once meaningful relationships are identified, SIGNAL can help inform optimization decisions and budget planning. The model can forecast both aspirational and realistic targets. Those details matter because they make the optimization layer not only more robust, but also more honest about uncertainty.

SIGNAL in the Measurement Framework
Earlier, I argued that most measurement frameworks are incomplete because they assume response is linear and credit is attributed (or weighted toward) to whatever happens closest to conversion, while upstream influence gets treated as narrative, noise, or “brand.” SIGNAL is designed to close that gap by measuring relevance and relationship patterns even when the response shows up later, is non-linear, or is distributed across multiple touches.
This is where the earlier claim of Time + Parity → Relationships stops being theory and becomes a measurement discipline. In SIGNAL, a “strong” signal is not just a high metric value. It is a reliable alignment between an upstream metric and a downstream KPI across specific time ranges. In other words: a strong signal is evidence that a touchpoint behaves like it belongs to the same decision journey as the outcome, even when that journey is messy, distributed, and slow.
In awareness-style campaigns, SIGNAL provides a direct KPI that connects influence to outcomes without pretending that impact must be immediate or last-click. Success is defined by how much of your media is resonating with the audience in a measurable way, even when the resulting action appears later, or is credited elsewhere in the journey by conventional conversion reporting.
SIGNAL offers a new KPI: Percent Strong Relevance
Percent Strong Relevance indicates what share of your marketing efforts are resonating with the audience in a way that is aligned to the business objective. Low values suggest that little of the campaign is landing; higher values are better. Using selective date filters, you can explore this metric over time to see whether relevance is improving or declining.
In practice, the timing insight comes from the Score Distribution by Weeks Leading: it shows whether strong relationships show up right away or build steadily over time, without forcing a single linear path to last-touch credit.
Recommended ways to use Percent Strong:
Use the Average Score Distribution pie chart to give you an overall number for your entire campaign. This is the highest level aggregation and can act as a constant bellwether for effective performance.
Use the Distribution by Weeks Leading bar chart as the timing view: report Percent Strong by time bucket so the organization can see when the campaign is showing the most resonance. Weakness here can indicate a need for better messaging at various stages in the decision journey.
For reporting, summarize with a single line:
“8% of placements are strong overall, and we are resonating most in the consideration phase of the customer journey”
Use similar language for moderate relationships as a way of showing where the opportunities for optimization lie. This ties measurement to action without reverting to last-click dependency.
Use shifts in the distributions as a targeting trigger. If the overall pie moves toward Weak, revisit parity (correct predictor? correct KPI?).

In engagement and conversion campaigns, SIGNAL provides supporting metrics that show where touchpoints are contributing in non-linear ways that conventional reporting can’t easily value. In these cases, SIGNAL is not the primary KPI; instead, the SIGNAL Score functions as a diagnostic measure that help identify non-linear support, timing effects, and optimization opportunities—especially when influence is distributed across multiple time frames. From this we can answer several key questions:
What is resonating with the audience?
Are we seeing pull-through for specific placements?
What do we learn about timing and messaging?
How should budgets be adjusted?
These reporting cuts do one thing that most frameworks avoid: they let teams talk about upstream impact without retreating into “brand” abstractions. They treat influence as a measurable relationship with an observable timing profile, and they keep the work anchored to the same downstream outcomes the business actually cares about.
In this way, SIGNAL enriches the traditional measurement framework by accounting for non-linear, non-proximate response—while staying anchored in business outcomes.
Decision Information, Not Crystal Ball
A critical discipline in SIGNAL is the refusal to overclaim. Correlation is evidence, not proof. Temporal and strategic parity strengthens the case that a relationship may be meaningful, but it does not mean there is causal certainty. Because the system scans many items across many time ranges, some attractive patterns will always appear by chance, and some relationships may be distorted by seasonality, schedule persistence, or data-quality problems.
For that reason, the proper role of SIGNAL is hypothesis generation plus disciplined validation.
Strong relationships justify testing with greater confidence.
Moderate relationships justify cautious exploration.
Weak relationships justify skepticism, reframing, or reprioritization.
In practical terms, SIGNAL should be understood as a framework for revealing where historical patterns suggest hidden influences that traditional attribution frameworks can miss, not as a predictor to drive future results.
Summary: “Everything in Its Right Place”
Direct response data gives a clear picture of what's closing conversions.
SIGNAL gives a picture of what's building the conditions for those conversions to close.
Used together, they give a more complete picture of what is fueling success and where the opportunities are.
The deeper vision of SIGNAL is simple. Marketing systems are often misread because most measurement frameworks have critical limitations that cause blind spots. Some touchpoints are judged too late. Others are judged too early. Some are given too much credit because they happen to be in the right place at the right time. Others are stripped of value because they work quietly, in combination with other touches, far upstream where no one is looking.
SIGNAL exists to put those relationships in their right place.
It does not deny the importance of direct response. It does not romanticize awareness. It does not assume that every impression matters. Instead, it asks where each signal belongs in the larger influence system. Which relationships seem real? Which appear delayed? When do they gain and when do they fade? Which are weak despite heavy spend? Which are promising but underfed? Which combinations begin to look like an actual journey?
Marketing influence is broader than last-click, more specific than vague awareness rhetoric, more consequential than “vanity metrics”, and more operational than static aggregate models. By anchoring all measurements to common business outcomes, SIGNAL creates a practical method for discovering what is actually relevant in the long path to conversion.
“Everything in its right place” is not just a line. It is the vision of the system—to make marketing measurement more complete, more disciplined, and more real.